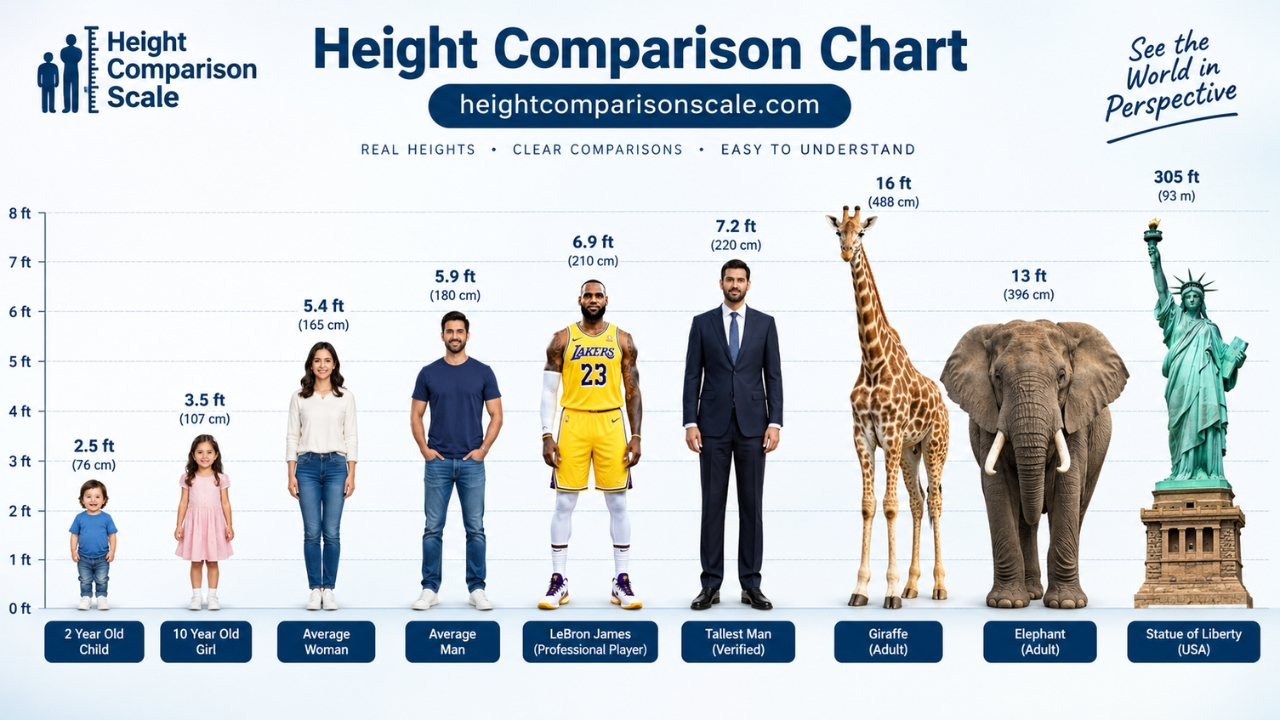
A height comparison chart is a visual tool that lines up two or more heights side by side so you can instantly see the difference between them, without doing any mental math. Instead of reading “5’6″ vs 6’1″” as two abstract numbers, a chart shows you the actual gap — which is often more dramatic (or less) than people expect. These charts are used far more widely than most people realize: parents track a child’s growth against pediatric percentile charts, casting directors and costume designers compare actors’ heights before pairing them on screen, athletes and coaches study height differences in sports like basketball or volleyball, and curious readers just want to know how they stack up against a celebrity, a historical figure, or even a fictional character.
The appeal is simple. Numbers on a page don’t give you an intuitive sense of scale, but a proportionally drawn bar or silhouette does. That’s why tools built specifically for this purpose, like height comparison, let users type in names or numbers and get an instant visual rather than a spreadsheet of figures.
How to Read a Height Comparison Chart Correctly
Not all charts are created equal, and misreading one is a common mistake. Here’s what to check before trusting what you see:
- Confirm the scale is proportional. A good chart keeps consistent units (inches, centimeters, or feet) across every figure shown. If the bars or silhouettes look off relative to the stated numbers, the scale may be distorted.
- Check the measurement source. Celebrity and public-figure heights especially are often self-reported or estimated, and can vary by an inch or two between sources.
- Look for units clearly labeled. Confusing feet-and-inches with centimeters is one of the most frequent errors when comparing two people from different countries.
- Account for footwear and posture. Publicly listed heights sometimes include shoes, which can inflate a number by half an inch to two inches.
Once you know a chart is built on a consistent, labeled scale, the visual comparison becomes genuinely useful rather than just decorative.
Average Height by Age and Gender (Quick Reference Table)
Below is a general reference table based on widely cited growth data. Individual variation is normal, and genetics, nutrition, and health all play a role.
| Age Group | Average Male Height | Average Female Height |
|---|---|---|
| 10 years | 4’6″ (137 cm) | 4’6″ (138 cm) |
| 14 years | 5’4″ (163 cm) | 5’3″ (160 cm) |
| 18 years | 5’9″ (176 cm) | 5’4″ (163 cm) |
| Adult (20+) | 5’9″ (175 cm) | 5’4″ (162 cm) |
Figures are approximate global averages and vary by country, ethnicity, and individual growth patterns.
Common Ways People Use Height Comparison Tools
Beyond simple curiosity, these charts serve real, practical purposes:
- Parents and pediatricians use growth charts to monitor whether a child is developing within a healthy percentile range over time.
- Fashion and costume teams compare model or actor heights when planning outfits, camera angles, or group shots.
- Sports analysts use height data to evaluate matchups — a few inches can meaningfully affect performance in basketball, rowing, or gymnastics.
- Furniture and product designers reference average height ranges when setting standard dimensions for counters, doorways, or seating.
- Casual users simply enjoy comparing themselves to celebrities, athletes, or historical figures for fun.
Why Height Perception Isn’t Always What You Expect
One thing a good comparison chart reveals is how unreliable human perception of height actually is. Camera angles, footwear, and even the people standing nearby can make someone look taller or shorter than they really are. A visual side-by-side strips away those distortions and shows the real difference, which is often smaller — or larger — than the impression you got from a photo or video. This is part of why these tools have become popular well beyond their original practical uses: they correct a very common, very human misjudgment.
Height Comparison Chart: A Simple Way to Visualize the Numbers Behind Every Inch..
Frequently Asked Questions
Q: How accurate are celebrity heights listed on comparison charts?
A: They’re often close but not exact, since many public figures’ heights are self-reported and can be rounded or slightly inflated. Treat them as reasonable estimates rather than verified measurements.
Q: What’s the difference between a height comparison chart and a growth chart?
A: A growth chart tracks one person’s height over time against age-based percentiles, usually for medical purposes. A height comparison chart simply shows two or more heights side by side at a single point in time.
Q: Can I compare heights in both feet/inches and centimeters?
A: Yes — most reliable tools let you switch or view both units at once, which is useful when comparing figures from countries that use different measurement systems.
Q: Why do two sources sometimes list different heights for the same person?
A: Differences usually come from measurement timing (heights can vary slightly morning vs. evening), footwear, or the original source simply being an estimate rather than a verified measurement.